Friday, January 23, 2015

DynaTrace Monitoring Dashboard Metrics Explained


All these metrics can be seen in monitoring dashboard. You can open monitoring dashboard by clicking “Monitoring” button on the top left hand side on the open dashboard as shown below.


1) Throughput (Requests/Minute):  The “Throughput” chart shows the Throughput count and expected range based on data of the last week. 


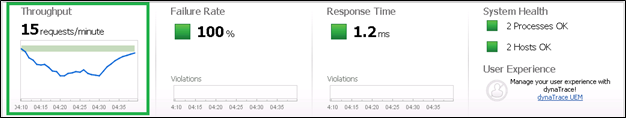
There are no violation alerts as you notice in other metrics like “Failure Rate” and “Response Time” since variation in Throughput does not automatically signals an issue in application.
However if Throughput = 0, it may be the case that Application under test is not available.
How dynaTrace creates Baseline for “Throughput”?
dynaTrace calculates the expected range for this metric based on historical data. The time frame for historical data is previous week. If data for previous week is not available dynaTrace may use samples set from previous day, previous hour or from some time frame from start of current base lining.
2) Failure Rate: dynaTrace is capable of detecting all kind of unexpected events while a application is running. Some of the common errors are http errors like 4XX and 500 errors, JAVA exceptions etc.
dynaTrace creates a violation when at least one business transaction currently for application under test produces more failures than historical values of previous week (as shown in snapshot below).


If you click on “Failure Rate” as shown below in “Business Transactions” section you will see a new dashlet for “Failure Rates” focus only. As shown below.


Here –
Red line – Indicates Violations.
Blue Line – Indicates Failure Rate Trends.
Green Line – Indicates Failure Rate baseline.

How dynaTrace creates Baseline for “Failure Rate”?
dynaTrace uses binomial distribution for creating baseline for failure rate. Failure “Violations” are reported if measurements of failure rate at any particular time are statistically significant. Statically significant means there are enough request/minute (Throughput) to be certain that data is reliable.

3) Response time:  dynaTrace shows two values for Response times on monitoring dash dashboard.
a) Median Response time: This is the actual response time of current response time.
*Median - For data set having odd number of elements: value of middlemost element.
- For data set having even number of elements: mean of 2 mid most element.
b) Response time for slowest 10%:  This is the Average of all the values of response times which are more than the 90th percentile Response time value.
If you click on “Response Time” section of “Business Transactions” section of “Monitoring Dashboard” you will land up in the “Response time” dashlet. As shown below.


There will be another dashlet section on this page to the right hand side pane called “Response time (slowest 10%)”. If we click on that section it will minimize the current dashlet and open the “Response time (slowest 10%)” dashlet.


How dynaTrace creates Baseline for “Response Time”?
dynaTrace unlike other monitoring tools do not take averages or standard deviations for creating baselines.
Median – Baseline value is 50th percentile of all the response times.
Slowest 10% - Transactions having response time’s more than 90th percentile of all the transactions.

4) System Health: This portion of “Monitoring Dashboard” will display the state of “Processes” which are running and “Hosts” on which these are running.
There will be following which can be shown there:

GREEN – OK
RED – UNHEALTHY
Percentage – By which Process or Host is affected negatively.
GREY – N/A


If you hover on the status color for “Process” or “Hosts” you can see “Application Process” and “Hosts” hyperlink respectively. If you click on those links you will be taken to “Applcation Process” details and “Hosts” details pages as shown below.


Friday, January 16, 2015

dynaTrace - Introduction (Theory)

What is dynaTrace?

Dyna trace is a monitoring and profiling tool for Java and .NET applications. It uses PurePath technology to pinpoint and resolve any application performance problems.
It can capture the detailed execution path of every transaction that happens in an application. Detailed execution path here means complete end to end flow of functionality from client to web browser to database servers. dynaTrace also monitors infrastructure metrics like app server, web server, database server etc.

Why dynaTrace ?

1) dynaTrace provides visibility of every transaction at different levels of application architecture like frontend (browser/client), server layer (web or app server) and backend (database server).
2) Provides excellent profiling data capturing and analysis  capabilities.
3) Easy to install and configure.
4) Less overhead. < 5%.
5) Deployable to monitor complex and heterogeneous application environments.

What is PurePath technique?

PurePath is dynaTrace's transaction details capturing technique. Using this technique dynaTrace provides the exact transaction level details from end to end perspective. Since the details are provided dynamically while the application is under test detecting performance anomalies like figuring out slower transactions is quick.
PurePath is capable of detecting performance issues at code level and details transactions invoking external services too.

How dynaTrace works?

dynaTrace uses SENSORS which are small chunk of code injected into application to be monitored at different points in the application. dynaTrace has many built-in sensor packs called knowledge sensor packs that can retrieve data from wide set of application servers and application frameworks. At the entry point of pure path active sensors are placed with required configuration. Knowledge sensor packs for servlets, web services etc. already define these entry points. There are another type of sensors called auto sensors which provide additional information of the transaction's pure path without user-defined sensors.
dynaTrace also allows users to create user defined sensors by using sensor rules. These set of rules specify sensor's location and allow to access data of methods such as its return values.


Thursday, January 8, 2015

fprintf() in Vugen

fprintf() function comes in very handy in many situations, two of which i come across are:

1) Keeping track of which login ids from the given login ids were able to login to application.
2) If the script fails during run time and we want to record the group name and Vuserid for finding the root cause after the execution.

  This function writes a fomatted output to stream
 
   Declaration - int fprintf( FILE *fp, const char *fs [,arguments ] );
  
   fp = Pointer to a file (actually stream)
   fs = Formated string we want to write to the file (actually stream)  
  
   Return Value -

   On sucess - Total number of characters printed.
   On error - Negative number
        
   fs or the formated string can be formated using different format tags prototype of which is %[flags][width][.precision][length]specifier
  
   Most common specifiers are following:
  
   %d = Displays and integer
   %f = Displays a floating-point number in fixed decimal format
   %e = Displays a floating-point number in exponential notation
   %s = Displays string of characters
   %u = Displays unsigned decimal integer
   %c = Displays a character
     
   Since most of the format tags will never be used and there are lots I am just giving one or two examples for all the tags below.
  
   Flags =  flags can be used for various purposes. Main is to format data as per requirment. For example -
   1) - = is used to left justify the field.
   2) 0 = to pad field with zeros rather than blanks.
  
   Width = Every data format is provided with minimum required width to hold the same. Width format tag can be used to increase it further.
  
    1) %[width]d - will increase the field width of given integer.
 2) %[width]s - will increase the width of given string.
  
   Precision = This format tag takes different meanings for different format types.
  
 1) %[total].[decimal]f - Here total field length will be [total] and [decimal] of these will hold the decimal part for a float value.
 2) %[minimum].[maximum]s - Here minimum width is [minimum] and maximum width is [maximum] for a string value. If string is more than [maximum]
       value it will be cropped to [maximum] value.
  
   Length = length modifier is used to let printf know that we want to print very big or very small variables. For example -
  
   1) short int - Modifier to be uses in this case is 'h'. Short int is always takes less or equal bits as int. that is short int <= int <= long.
   2) long double - Modifier to be used in this case is 'L".
   
  Code for all the above cases is as follows. Uncomment the part you want to try and copy paste it in fprintf_function() below.
 
   count = fprintf(fp,"%-10d %c",143,'k'); // Flag Example 1. cfunctionfile.txt will have : 143        k, Count = 12 in output. 143 will be followed by 7 blanks + 1 space and k
  
   count = fprintf(fp,"%010d %c",143,'k'); // Flag Example 2. cfunctionfile.txt will have : 0000000143 k, Count = 12 in output. 0 padded to the left.

   count = fprintf(fp,"%hd",1); // Length Example 1. cfunctionfile.txt will have : 1, Count = 1 in output

   count = fprintf(fp,"%Lf",10.000000001223); // Length Example 2. cfunctionfile.txt will have : 10.000000, Count = 9 in output
 
   count = fprintf(fp,"%4d",7); // Width Example 1. cfunctionfile.txt will have :     7, Count = 4 in output

   count = fprintf(fp,"%15s","kbanyal"); // Width Example 1. cfunctionfile.txt will have :         kbanyal (8 spaces before kbanyal), Count = 15 in output

   count = fprintf(fp,"%10.3f",546666.7); // cfunctionfile.txt will have : 546666.700 , Count = 10 in output

   count = fprintf(fp,"%3.4s","kbanyal"); // cfunctionfile.txt will have : kban , Count = 4 in output


Vugen C Code -

/* Output of following can be seen in the folder where this script is saved and in text file named - cfunctionfile.txt */
 
fprintf_function()
{
 int count;

 int fp = fopen("cfilefunctionfile.txt","w");

/* Opens a file for buffered I/O. File name is cfilefunctionfile.txt (will be created in script folder once executed.). Access mode is write "w". */

 if (fp==NULL) 
/* fopen() returns NULL if for some reason file was not opened. Make "cfilefunctionfile.txt" read only to see this if condition working.  */
 {
  lr_error_message("File %s was not opened due to some error",fp);
 }
 
 count = fprintf(fp,"%d %e %f %s %u %c", 21, 2e12, 23.43, "Kbanyal", 007, 'k');

/* fprintf() will write to "cfilefunctionfile.txt" file if fopen() above was successfull and return number of characters written to file. */

 lr_output_message("%d",count);

 fclose(fp);

 return 0;
}