Every time we run a performance test we want to catch any
performance issue in the application through monitoring it. Many a times we
rely on generated reports post execution to analyze performance of the
application.
If you are experienced software application performance
testing professional you will agree that we cannot conclude where the
performance bottleneck is based on just one or two result metrics. We may need
to correlate large number of metrics and results to form an opinion about a
bottleneck.
Since there are many performance metrics (depend on the
scope of testing and complexity of an application) we don’t know how to analyze
the results.
Following are some of the approaches and techniques we can
use to find the root cause of performance bottleneck in a software application.
Symptom – Periodic High response
time
1) Correlate with Available thread count
If Available thread count – Low
Reasons
may be –
Frequent
GC leaks
Backend
choke point
So if available thread count is low that
means the threads which are getting executed are taking more than usual time to
complete processing and hence free threads are getting grabbed.
Two of the prominent reasons for threads
taking more time to execute than normal are Frequent GC leaks (threads which
are taking longer for processing are not getting killed or there are deadlock
issues for shared resources which is stopping GC from killing these threads)
and Backend is slow (There may be some database server or a third party server
which is taking time to process).
We can conclude above point if we look in
threads metrics of any performance monitoring tool.
Following snapshot from dyna trace can be
helpful.
We can check if number of busy threads are
getting increased over time.

Pool size – Total number of threads allowed
to be created. Active threads.
Free pool size – Number of threads which
are idle. Number of available threads.
Waiting thread count – Number of threads
which are in execution. Number of threads in use.
Typically there are following types of
thread pools on IBM WebSphere application server –
a)
WebContainer – For HTTP requests
b)
ORB – RMI/IIOP requests
c)
Messaging thread pool
a)
Worker
threads – These are the code processing threads and require operating
system services.
b) I/O threads – These are threads which
need device driver services.
2) Correlate with CPU utilization
If CPU utilization – Low
Reason
may be –
Internal
chokepoint
There are two kinds of processes in any application.
CPU bound – In
these kind of processes, processor services are required to process the code.
I\O bound – In
the kind of processes, device driver services are required to send data to or
out of system.
If we have more number of CPU processes in the application
than CPU utilization tends to be higher.While if more of the processes do I\O activities then
average CPU utilization will be low, since CPU will be idle in those cases.
Now if we see that we have low Average CPU utilization but
see response time spikes this may be because of high I\O processes or threads.
There may be issues in application code which certainly is making application
wait for non CPU bound processes to complete.
Symptom – Consistent High
response time
Correlate with – Low available
thread count
Reasons may be –
Inefficient code
Overuse of external
system
Slow backend
Too many layers
If we observe high response times consistently and also see
that available thread counts are low, this means threads are taking more time
to process indicating any bottleneck in the down system. There are many reasons for low available thread count like inefficient
code. Coders may have kept the number of threads low anticipating less service
calls to a particular functionality or the threads are not killed after they
have waited for long for an event to occur. Another reason may be overuse of
external down system. This system may have a capacity issue. Slow database
server is another reason which is keeping threads busy overtime. Threads may be
waiting for database connection for longer due to database or network issues. Or
there can be a case where too much layering is in application design. We may
need to drill down these reasons further to blame the issue on any particular
reason.
Shown below is high level diagram of a 3-tier application.

Another reason for consistent high response time may be Network bottleneck.
If everything at server side looks good this is the only
culprit which needs to look at for any issues.
Following diagram show the Network time vs Transaction
response time.
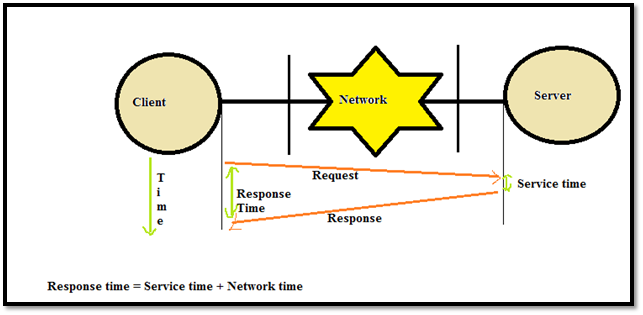
Now the above diagram is a simplified view of request and
response. Actual request and response is a collection of data packets (in case
of TCP) as you know data on networks travel as packets.
Request which the client sends to a server may consists of
more than one packet as well response from server may also be made of more than
one packet of data. In that case we have to further breakdown our generalized
diagram above to something as shown below.

Now client wants all the
requests to reach server, processing by server and complete response to be
reached back to it quickly. So for client the importance of time starts when it
sends the first packet of data and received the last packet of response.
But for server the time
between last request packet received and first response packet send is
important because by that time it has finished the service it is asked for and
now it is networks liability to make this complete response to be available to
client.
Time taken by Request or
response packets to reach server and client respectively depend on many factors
like –
1) Bandwidth – How much data in bits can be transferred to and fro
on a network medium. In today’s networks bandwidth is typically measured in
millions of bits per second. It is a physical layer property of network models.
For example – If we say our computer is connected to network using 56 kbps
dialup modem this means that the bandwidth of this medium is 56 kbps.
2) Latency – Latency is how much time it takes for a packet of data
to get from one designated point to other. In some cases round trip time (packet
send and received at source) is considered as latency.
You can get a rough idea
of latency using PING command in
windows.

3) Load
If you see that all the
server metrics are healthy and there is no other reason like slow backend
system or slow database server than look into the performance of your network.
We can analyze impact of network on our application using different
virtualization tools. One such tool is HP Shunra through which we can
virtualize our network conditions and analyze impact of same in our application
performance.
Correlate with –
Symptom – Progressive High
response time
1) Correlate with – Low TPS
Reasons may be –
Memory leak
Memory leak is a condition where application do not return
memory which it will not use any more. There are many bad coding ways through
which it can happen. Memory leaks can be detected by looking into memory
utilization graphs where utilization keep on increasing over time.
There may be many causes of memory leak like non recovery of
objects which lost reference during execution of code, cleanup errors or
inappropriate session handling for web applications.
If Memory leakage continues it will result in lower
transactions being processed by the application over time. Eventually if system
continues to loose memory application will crash after a point of time.
In the following graph you will see both the JVMs crashed
over a time span after system goes on loosing memory.

We can see memory on the server using different ways or
tools. On simple case is windows servers where we can use windows in build
resource monitor to watch the memory.
Go to run and write resmon.exe and press enter. Go to Memory
tab. Click on Private(KB) column of the Processes table and you will get in
Process name decreasing order based on their Memory consumption. From here we
get single out processes which are taking more Memory.

Check the %Processor time and processor queue length graphs.
%Processor time
gives the average utilization of all the processors on a windows server. Now if
it is below 70 or 80% it is considered a good value (depends on application to
application but this is most general ideal case). If %Processor time remains
above this consistently this represents a performance bottleneck and we may
need to add new hardware. There is another metrics on a windows server which
convey the CPU performance issue i.e. Processor queue length.
Processor queue
length represents the number of threads waiting services of processor at
any particular point of time. Ideally this value should be 2 times the number
of processors and if it is more than 2 it shows that threads are waiting for
longer than ideal time for processing due to burden on processor.
There are different ways on different operating systems to
see processes which are using more processing time. In simple case on a windows
server we can use resource monitor to see this.
Go to run and write resmon.exe and press enter. Go to CPU
tab. Click on CPU column of the Processes table and you will get in Process
name decreasing order based on their CPU consumption. From here we get single
out processes which are taking more CPU. Below is the snapshot -
