In this blog I will try to answer folowing two questions from dynaTrace transaction management perspective -
1) How do dynaTrace follow every single click of user on an
application?
2) How can we follow the dynaTrace transaction path and look for
performance issues and reasons?
dynaTrace has the ability to track the interaction of user
with the application. dynaTrace achieve this by using an agent based solution. It has agents support for Java,.net
and PHP right now ,while Ruby, python agents support is in work right now.
dynaTrace tracks every single user
click. When user interacts with the application all the agents work in
conjunction to stitch together user interaction across multiple tiers called
pure path. The agents collects specific information about the transaction and
send it to data base server. Server analyses all the data and put it as single
user action. User action can be running a java script or download a file etc
etc.
We can use dynaTrace to analyze all the transactions of every single user and
can figure out the issue in any business process. We can export this
transaction session and send it to developer who can analyze the transaction
from the individual user perspective and find out how user performed that
transaction flow.
This enables developer to analyze and fix responsibilities for
fixing the issue.
For example while analyzing the particular transaction
developer can look for which search parameter the user used or which SQL query
was executed for the parameter. These kind of granular details can help triage
better and optimize systems better.
Lets see how this works –
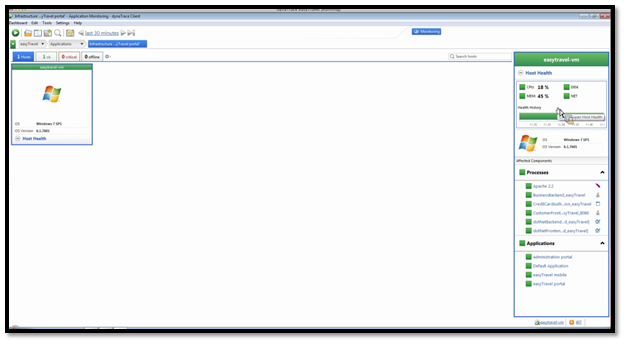
We are at the dynaTrace application dashboard from where we can have the high level monitoring of the applications.

Example if we have any issue with any of our machines
(hosts) somewhere in the transaction flow we will see “System Health” section
in red. To find out what is wrong we can click on this particular space on dashboard which will directly land us on
the host dashboard which will give us the high level details of what’s wrong
with any of the hosts on transaction path.
On the right side of the dashboard we can see the CPU and
Memory status of the host, and also the Processes and Applications associated
with this host.
Further we can click on any of the processes attached to
this host shown on the right side of the dash board to get the high level
details attached to that process. Here we can see from this process’s context, if
there is some CPU, threads , GC or a Memory issue.

Now on the above screen we have the diagnostics tools
available. For example if you see a GC issue and want to see GC dumps just
click on “Thread dumps” and we can land right there. No need to go to command
prompt and find the dumps using old fashioned ways.
Note - dynaTrace can show if you have network latency but
dynaTrace do not allow you to drill down why is there network latency?
Now to dive into a particular business transaction which
have some issues. We need to click on that particular business transaction on
the application dashboard.
Example as below if we have issue with logins we can click
on the "login" transaction and we will land on the transaction flow page of the "login" transaction. This page view show us the transaction mapping across
the system architecture.
Note - "login" transaction name is just a generalization, you may have some other transaction name for this business transaction like "Log on", "Get me started", or something else.


If we hover on any of the hop in the transaction flow we can
drill down to the different metrics which we have seen above too.
At any point hardware or software or database related drill
down can done easily and quickly by clicking on that particular item in the transaction flow.

At any point if every thing looks good and there is no red
line coming up on the screen but any user is experiencing a performance issue
then we can also search that particular user (with session id or user id according to your application setup) and find out in detail its interaction with the system. This user specific drill down is very useful to single out the exceptional issues with any particular set of configuration or data.

dynaTrace will highlight
all the interactions of this user as follows. There will be details of
all the user actions exactly the way user interacted with the application.
These are the actual activities performed by this user not any
aggregate values or something else.

We can further drill down the user action for different
details and get to the most granular details of sub actions performed.


If we see any error or some issues in the drilled down view
we can export the details and share it with the developer or Application support
people. So these teams have the same level of details as we have.
They can directly get the required details with minimum
explanations and reproduction of issue.
They also know the user flow till the error or exception
occurred.